You got a JSON Schema written by someone else and have difficulty understanding why your data is not checked as you expected? Wouldn’t it be nice if you could step through the validation process and learn how the schema is applied to your JSON? Are you already thinking about a JSON Schema validation debugger?
You changed something in your JSON Schema and you want to be sure quickly, that your instance location is still validated? Setting a breakpoint in your JSON data would be very helpful in this case.
You check a huge JSON document with thousands of lines and you want to see in seconds what schema part validates a certain key? Just use the debugger and set a breakpoint at any JSONPointer location.
Well, there is a JSON editor available where you can do this and even more. Just start JSONBuddy Plus and run the JSON Schema validation debugger with a single click:
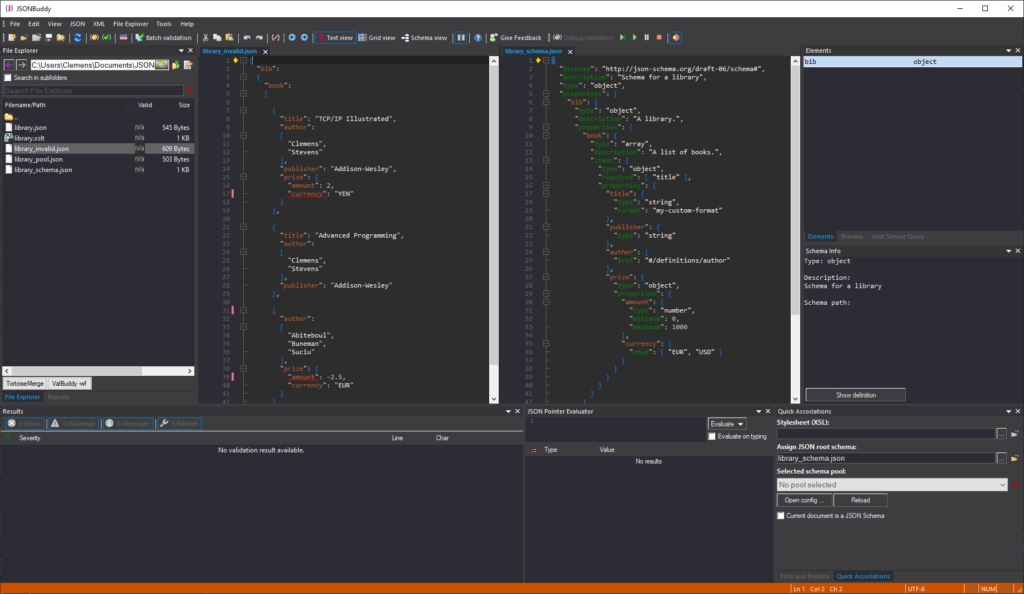
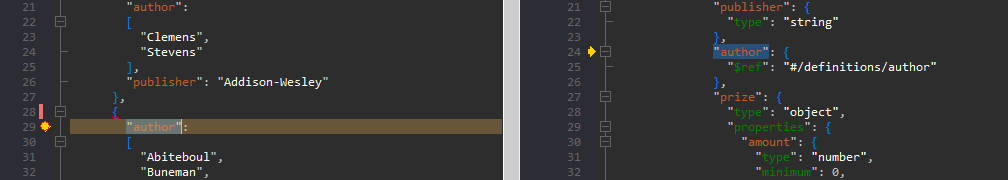
The JSON editor will then arrange the instance document to the left and the root JSON Schema file to the right. The locations of the first validation steps are marked with yellow arrows in the left margin areas of the editor windows. The current lines are also indicated with an alternative background color. Therefore, the current validation step is always clearly visible.
Debugging commands

You can find all of the usual debugger commands in the toolbar. Often it will be quicker to use the keyboard. Press F8 for a single step and Ctrl+F8 to run until the next breakpoint or validation error. There is also an option to toggle if the debugger should break whenever a validation error occurred.
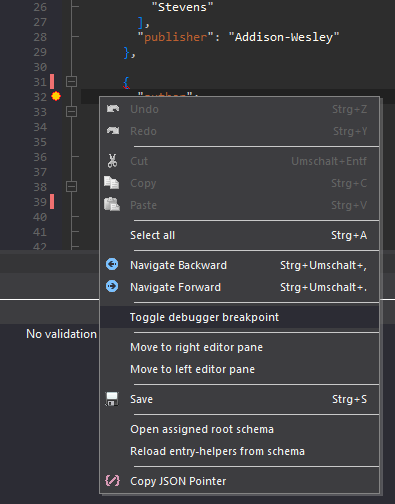
A breakpoint can be set in the instance document and any referenced JSON Schema file with the right-mouse-click context menu in the text editor window.
Getting a deeper understanding of the JSON Schema validation process is only one reason to use the debugger. It saves a lot of time on getting a schema ready for production. But don’t forget to restart the debugger session if you modify any of the JSON Schema files.
Editing the JSON input data while debugging
Furthermore, it is possible to edit the JSON data while the debugger session is active. Jump from error to error to resolve and fix any issues in the instance.
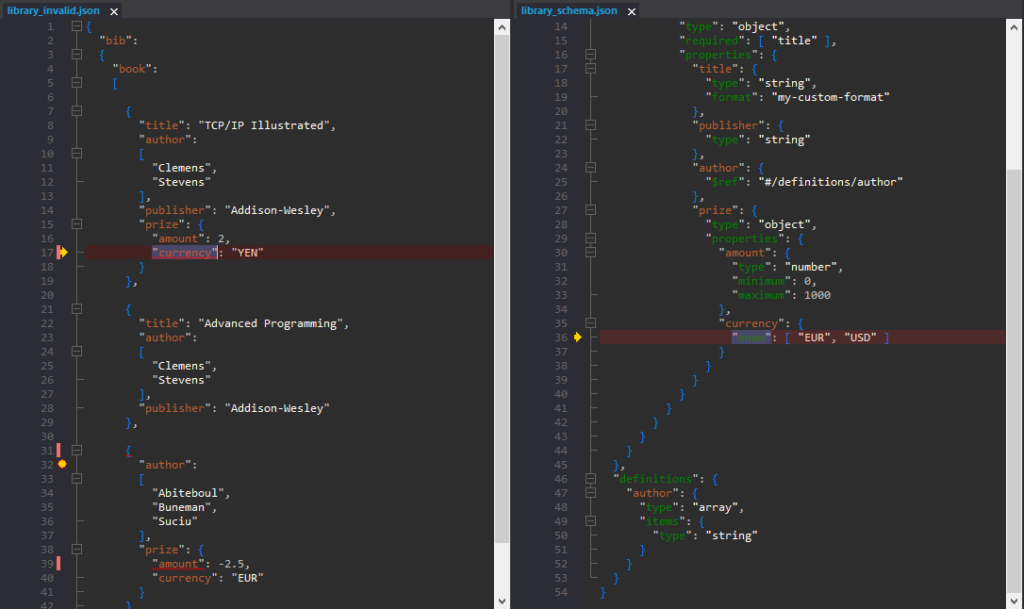
In order to give additional details about the error, all of the usual context information and indicators are also available while running the debugger. As a consequence, it is often easy to apply the fix.
Please note, that major changes to the structure of the JSON input can result in making it impossible for the debugger to find any subsequent error locations. In this case, it is recommended to restart the validation in the JSON editor.
Don’t underrate the benefits of a debugger
Learn about the details of an unknown schema. Resolve errors in JSON data step by step. Not to mention, check if a property is validated in huge JSON documents quickly. The benefits of having a validation debugger in your JSON editor are numerous.